a. Identification. The sinus node loses its pacemaking role, and the site with the fastest rate becomes the pacemaker.
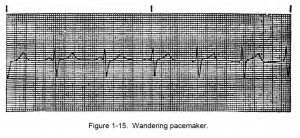
In this case, the atria is the fastest pacemaker and takes over the pacemaking role. The P wave configuration of atrial rhythms may be flattened, notched, peaked, sawtoothed, diphasic, or upright. The QRS complexes are narrow. Atrial arrhythmia may be caused by irritability of the heart or escape mechanisms of the heart.
NOTE: An escape mechanism is defined as an impulse from somewhere along the conduction pathway that “escapes” to emit an electrical impulse of its own. This electrical impulse stimulates an otherwise electrically quiet heart.
b. Wandering Pacemaker. Analysis of wandering pacemaker is given below and an example is shown in figure 1-15.
![1-08. ATRIAL RHYTHMS 1 Wandering Pacemaker. By Jer5150 (Own work) [CC BY-SA 3.0 (http://creativecommons.org/licenses/by-sa/3.0)], via Wikimedia Commons](https://brooksidepress.org/ecg/wp-content/uploads/2015/11/wandering_pacemaker-300x50.png)
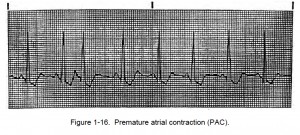
c. Premature Atrial Contractions. Analysis of premature atrial contractions (PAC) is given below and an example is shown in figure 1-16.
![1-08. ATRIAL RHYTHMS 3 Premature Atrial Contraction. By Chikumaya (My Own Work) [Public domain], via Wikimedia Commons](https://brooksidepress.org/ecg/wp-content/uploads/2015/11/PAC-300x46.png)
(1) Premature atrial contractions are single heartbeats that originate in the atria and come early in the cardiac cycle. The rhythm depends on the underlying rhythm that will usually be regular except for the premature atrial contraction. The heartbeat rate is usually normal depending on the underlying rhythm.
(2) The P waves of the early beat differ from sinus P waves. These P waves can be flattened or notched and thus lost in the preceding T wave.
(3) The P-R interval is 0.12 to 0.20 of a second, but can be greater than 0.20 of a second.
(4) The QRS is less than 0.12 of a second.
(5) Isolated PACs may occur in “normal’ cardiovascularly healthy people. Frequent PACs may indicate organic heart disease and possibly initiate atrial tachyarrhythmias.
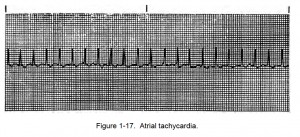
d. Atrial Tachycardia. Analysis of atrial tachycardia (AT) is given below and an example is shown in figure 1-17.
(1) Atrial tachycardia (AT) is caused when a single focus in the atria fires very rapidly and overrides the SA node.
(2) The rhythm is regular and the heartbeat rate is 150 to 250 beats per minute.
(3) The atrial P wave differs from the sinus P wave and can be lost in the preceding T wave.
(4) The PR interval is 0.12 to 0.20 of a second with the QRS less than 0.12 of a second.
(5) There are two forms of clinical atrial tachycardia: paroxysmal AT/supraventricular tachycardia (PAT/PSVT) and nonparoxysmal AT.
(a) Paroxysmal AT/supraventricular tachycardia is characterized by repeated episodes of atrial tachycardia. The episodes may begin abruptly and last from a few seconds to many hours.
(b) Nonparoxysmal atrial tachycardia is an abnormal heart problem that is secondary to some other problem.
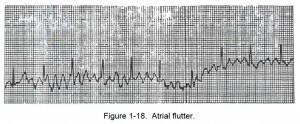
e. Atrial Flutter. Analysis of atrial flutter is given below and an example is shown in figure 1-18.
![1-08. ATRIAL RHYTHMS 6 Atrial Flutter. By James Heilman, MD (Own work) [CC BY-SA 3.0 (http://creativecommons.org/licenses/by-sa/3.0) or GFDL (http://www.gnu.org/copyleft/fdl.html)], via Wikimedia Commons](https://brooksidepress.org/ecg/wp-content/uploads/2015/11/atrial_flutter-300x68.png)
(1) Atrial rhythm is regular if the PP intervals are constant.
(2) The ventricular rhythm is regular if the AV node conducts impulses in a constant pattern. The ventricular rhythm is irregular if the AV node varies the pattern.
(3) In regard to the heartbeat rate, the atrial rate is 250 to 350 heartbeats per minute. The ventricular heartbeat rate depends on the ratio of impulses conducted to the ventricles.
(4) The P waves have well defined “flutter” waves and a sawtooth appearance.
(5) The P-R interval is not measured (impossible to determine).
(6) The QRS complex is less than 0.12 seconds.
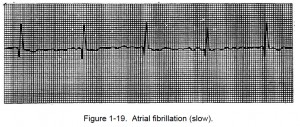
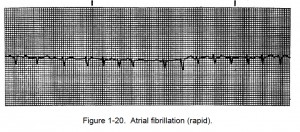
f. Atrial Fibrillation. Analysis of atrial fibrillation is given below and examples are shown in figures 1-19 and 1-20.
![1-08. ATRIAL RHYTHMS 8 Atrial Fibrillation. By James Heilman, MD (Own work) [CC BY-SA 3.0 (http://creativecommons.org/licenses/by-sa/3.0)], via Wikimedia Commons](https://brooksidepress.org/ecg/wp-content/uploads/2015/11/atrial_fibrillation-300x48.png)
(1) In atrial fibrillation, the rhythm is irregularly irregular.
(2) The atrial rhythm is unmeasurable and the R-R interval is irregularly irregular (ventricular). In regard to the heartbeat rate, the atrial rate is unmeasurable.
(3) If the ventricular rate is less than 100 beats per minute, it is controlled. If the ventricular rate is greater than 100 beats per minute, it has a rapid ventricular response that is uncontrolled.
(4) There is either no P wave or there are fibrillatory P waves in which case there is no depolarization of atria, and the waves at the baseline have chaotic undulations.
(5) The P-R interval cannot be measured.
(6) The QRS complex is less than 0.12 seconds.
(7) Atrial fibrillation is usually the result of underlying heart disease. Occasionally, this problem may occur in a normal patient or in patients with MI, especially if SA node infarction occurs. Rapid ventricular response reduces ventricular filling decreasing the stroke volume.
