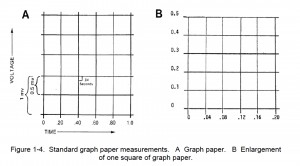
b. Electrocardiogram Graph Paper and Machines. Electrocardiogram graph paper and the speed of the EKG machines are standard and uniform.
Lines on the graph paper are horizontal and vertical with four light lines between two heavy lines. The horizontal lines indicate voltage. The electrical voltage of the heart impulse is measured in millivolts and determined by the magnitude of deflection (the power of a wave).
(1) Determination of electrical impulse strength. Compare the height of a wave spike to the horizontal lines to determine the strength of the electrical impulse.
(2) Vertical lines. Vertical lines indicate the speed of the electrical current traveling within the heart. The distance in time between two heavy vertical lines is 0.20 seconds and between two light vertical lines or across one small square is 0.04 seconds.
(3) Heavy lines. Heavy lines are necessary to determine rates, rules, and normal values. Light lines are composed of five small columns between two heavy vertical lines.
(4) Squares. There are 25 squares in each large square.
(5) Standard rate of EKG paper. The standard rate of EKG paper travels past the stylus at a rate of millimeters per second.
(6) Graph paper markings. The markings on the graph paper can be examined and compared to normal markings to give the reader an idea of the electrical activity of the patient’s heart. See figure 1-4 for an example of standard EKG graph paper measurements.

