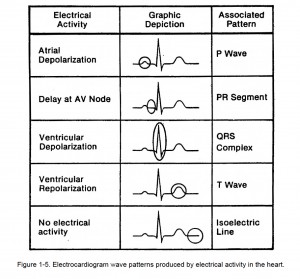
c. Electrical Impulses of Electrocardiogram Waves. Each part of the cardiac cycle produces a different electrical impulse.
The electrical flow of the heart starts with the SA node (right atrium) and continues to the Purkinje fibers (ventricles). Electrodes transmit impulses to a recording pen which graphs the impulses in a series of up and down waves called deflection waves. The cardiac cycle includes all of the wave patterns produced by electrical activity beginning with the pacemaker impulses and including ventricular repolarization.
Conduction system of the heart. By Madhero88 (original files); Angelito7 (this SVG version); [CC BY-SA 3.0 (http://creativecommons.org/licenses/by-sa/3.0)], via Wikimedia CommonsAn isoelectric line occurs when there is no current strong enough to produce either a positive or negative deflection. The positive and negative forces are equal with the result that a flat line is shown (usually following the “T” wave).
An electrical force (from the heart) toward the positive electrode will draw the stylus in an upright wave while an electrical force toward the negative electrode will draw the stylus in a downward wave.
![1-05. GRAPHIC DISPLAY OF ELECTROCARDIOGRAM (C) 2 ECG_principle_slow. By Kalumet (selbst erstellt = Own work) [GFDL (http://www.gnu.org/copyleft/fdl.html) or CC-BY-SA-3.0 (http://creativecommons.org/licenses/by-sa/3.0/)], via Wikimedia Commons](https://brooksidepress.org/ecg/wp-content/uploads/2015/11/ECG_principle_slow-263x300.gif)
(1) P wave. A small upward (positive) wave that indicates atrial polarization (the spread of an impulse from the SA node through the muscle of the two atria). The atria contract a fraction of a second after the P wave begins.
(2) QRS wave (complex). This second wave begins as a downward deflection and continues as a large, upright, triangular wave which finally ends as a downward wave at its base. This wave complex shows the spread of the electrical impulse through the ventricles.
(3) T wave. The third wave shows ventricular repolarization.
NOTE: There is no deflection to show atrial repolarization because the stronger QRS wave masks this event.
NOTE: Figure 1-5 shows EKG wave patterns produced by the electrical activity of the heart.


![1-05. GRAPHIC DISPLAY OF ELECTROCARDIOGRAM (C) 1 Conduction system of the heart. By Madhero88 (original files); Angelito7 (this SVG version); [CC BY-SA 3.0 (http://creativecommons.org/licenses/by-sa/3.0)], via Wikimedia Commons](https://brooksidepress.org/ecg/wp-content/uploads/2015/11/ConductionsystemoftheheartwithouttheHeart-en.svg_-300x174.png)