d. Size and Time Intervals of EKG Waves. The size of the deflection waves and particular time intervals are important when you are reading an electrocardiogram.

For example, the duration of a normal “P” wave is between 0.06 and 0.1 seconds, the time it takes for depolarization current to pass through the atrial musculature.
- An increased width of “P” wave may indicate left atrial abnormality or right atrial hypertrophy (enlargement).
- The deflection of a normal “P” wave is small due to the thin walled structure of the atria.
- A “P” wave is usually no more than 3 mm high. A taller “P” wave may indicate that atrial enlargement has occurred due to hypertension, coronary pulmonade, or congenital heart disease.
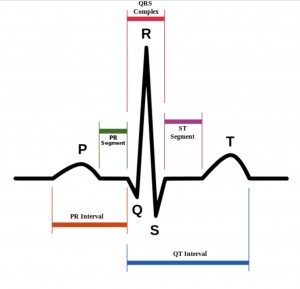
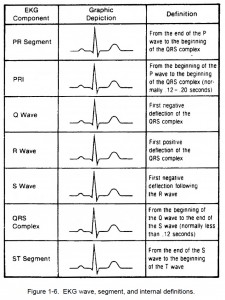
(1) P-R interval. Measured from the beginning of the P wave to the beginning of the R wave, this wave pattern represents the conduction time from the beginning of atrial excitation to the beginning of ventricular excitation. This is the time it takes for an electrical impulse to travel through the atria and atrioventricular node to the remaining conducting tissues.
A medical condition that disrupts this electrical impulse will display itself as a P-R interval that is longer than 0.2 seconds due to the increased time it takes to travel the conducting tissues. The normal P-R interval is between 0.12 and 0.20 seconds.

(2) Q wave. The Q wave is defined as the first down (negative) deflection following the P wave but coming before the R wave.
(3) QRS complex. This complex is made up of three waves: the Q, the R, and the S waves. The QRS complex represents ventricular depolarization. A normal QRS measurement is less than 0.12 seconds. The QRS complex is larger than the P wave on an EKG because ventricular depolarization involves a greater muscle mass than atrial depolarization.
(4) R wave. The R wave is the first upward (positive) deflection that follows the Q wave.
(5) S-T segment. Beginning at the end of the S wave ending at the beginning of the T wave, this wave represents the time between the end of the spread of the heart’s electrical impulse through the ventricles and repolarization of the ventricles. When a patient has acute myocardial infarction, the S-T segment is elevated. When the heart muscle does not receive enough oxygen, the S-T segment is depressed.
(6) T wave. Representing repolarization of the ventricular cells, the T wave is flat when the heart muscle does not receive enough oxygen; for example, in atherosclerotic heart disease. When the body’s potassium level is increased, the T wave may be elevated. This wave occurs after the QRS complex.
NOTE: Refer to figure 1-6 to see these waves.

(7) The refractory period. During this period, cell charges are depolarized and have not returned to their polarized state.
A cell that is electrically “refractory” cannot receive another impulse until it is repolarized. The refractory period on an EKG includes the QRS complex and the T wave. The absolute refractory period includes the QRS and the upslope of the T wave and is NOT a dangerous period.
The relative refractory period may allow depolarization of ventricles. This period occurs on the downslope of the T wave; it is dangerous if an impulse occurs at this time.
